

Can a SaaS company be growing quickly and still present a weak investment case? Yes. Growth can conceal customer losses, costly acquisition, or margins that are difficult to sustain. The key metrics for SaaS companies for investors matter most when assessed together, rather than treated as isolated indicators.
That makes due diligence more complex than comparing headline figures. Companies may define and report metrics differently, and results can vary with business model, target market, and stage of development. A growth rate that signals momentum at one company may mean something quite different when retention or customer acquisition efficiency is weak.
This 2026 guide explains how to assess growth, retention, customer acquisition, margins, and profitability as connected evidence of business quality and investment risk. It also outlines how to compare companies at different stages, validate reported performance, and consider valuation in context, including the differences between public and private SaaS businesses. For investors assessing technology investments, the aim is a repeatable framework that distinguishes durable, efficient growth from figures that need closer examination.
Key Takeaways
- Define recurring revenue and retention consistently so reported growth reflects durable customer relationships, not just new bookings.
- Assess CAC, LTV, and payback together, and examine the assumptions behind each calculation before drawing conclusions about efficiency.
- Compare companies with peers that share similar stages, customer segments, contract structures, and go-to-market models.
- Use the key metrics for SaaS companies for investors as a connected framework to evaluate business quality and investment risk, rather than relying on a single headline measure.
- Validate management reporting against contracts, billing records, financial statements, and customer cohorts before forming an investment view.
Key SaaS Metrics for Investors: What They Measure and Why They Matter
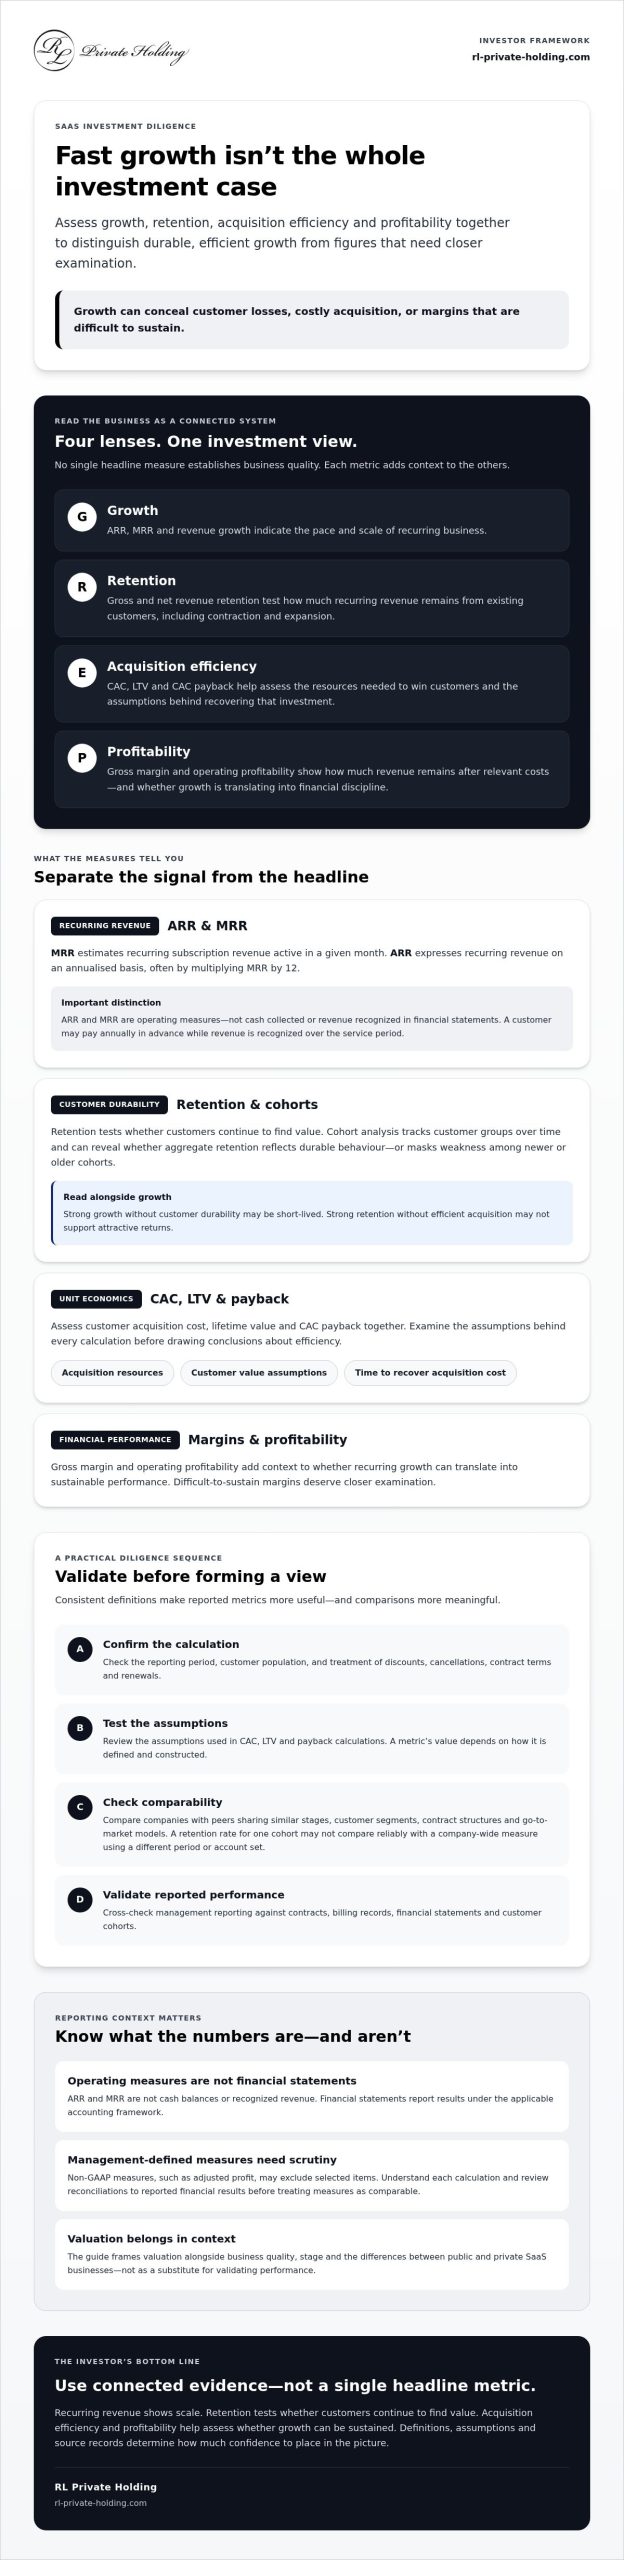
SaaS metrics are operating and financial indicators used to assess businesses that earn revenue from ongoing software subscriptions. They help investors examine how a company acquires customers, retains them, generates recurring revenue, and converts that revenue into sustainable performance. The key metrics for SaaS companies for investors are most informative when read as a connected set: growth without customer durability may be short-lived, while strong retention without efficient acquisition may not support attractive returns.
Quotable definition: “Recurring revenue shows the scale of a SaaS business, retention tests whether customers continue to find value, and their combination helps investors assess how predictable performance may be.” This is an analytical lens, not a guarantee of future results.
These indicators do not replace recognized financial statements. ARR and MRR are operating measures, not cash balances or recognized revenue. Financial statements report results under the applicable accounting framework; company-reported non-GAAP measures, such as adjusted profit, may exclude selected items. Understand each calculation, review any reconciliation to reported financial results, and avoid treating management-defined measures as directly comparable until you have checked their definitions.
What makes a SaaS metric useful to an investor?
A descriptive metric records what has happened, such as revenue growth over a completed period. A metric becomes more useful for assessing future performance when it helps test a business driver, such as whether existing customers renew or expand their use. Neither type proves what will happen next.
Consistency is essential. Confirm the calculation, reporting period, treatment of discounts and cancellations, and customer population behind each figure. A retention rate for one customer cohort cannot be compared reliably with a company-wide measure that uses a different period or excludes different accounts. One metric rarely establishes investment quality. Test reported growth against retention, acquisition efficiency, and financial results.
A compact map of SaaS investment metrics
Organise the measures into four connected groups:
- Growth: ARR, MRR, and revenue growth indicate the pace and scale of recurring business.
- Retention: Gross revenue retention and net revenue retention show how much recurring revenue remains from existing customers, including the effects of contraction and expansion.
- Acquisition efficiency: CAC, LTV, and CAC payback help assess the resources required to win customers and the economics assumed to recover that investment.
- Profitability: Gross margin and operating profitability indicate how much revenue remains after relevant costs and whether growth is translating into financial discipline.
ARR and MRR summarise contracted recurring revenue at a point in time, but they are not cash collected or revenue recognized in the financial statements. Their value depends on consistent treatment of contract terms, renewals, and cancellations. Cohort analysis adds another test by tracking groups of customers over time. It can show whether aggregate retention reflects durable customer behaviour or masks weakness among newer or older cohorts.
Recurring Revenue and Retention Metrics That Test SaaS Growth Quality
Recurring-revenue measures indicate the value of subscriptions a company expects to earn, while retention measures test whether that revenue endures. These are central to the key metrics for SaaS companies for investors, but their meaning depends on the company’s calculation policy and underlying contracts.
ARR, MRR, and recurring revenue quality
Monthly recurring revenue (MRR) estimates the recurring subscription revenue active in a given month. Annual recurring revenue (ARR) expresses recurring revenue on an annualised basis, often by multiplying MRR by 12. These are operating measures, not cash collected or revenue recognized in financial statements. For example, a customer may pay annually in advance while revenue is recognized over the service period.
Examine what management includes in these calculations. One-time implementation fees, non-recurring services, variable usage, discounts, and signed contracts that have not begun can affect comparability. Contract length and renewal terms matter too: a long commitment may support visibility, but it does not establish that customers will renew. Check customer concentration as well, since a small number of large accounts can make aggregate recurring revenue more exposed to individual decisions.
Confirm that ARR and MRR use consistent definitions across reporting periods and that annualisation is supported by active recurring contracts. Changes in methodology, unsupported run-rate assumptions, or inconsistent treatment of discounts warrant reconciliation before you use the figures in an investment assessment.
Retention, churn, and cohort analysis
Gross revenue retention (GRR) measures the share of recurring revenue retained from an existing customer group before expansion is included. It accounts for revenue lost through cancellations and contractions, but not increases in customer spend. Net revenue retention (NRR) measures revenue from that same group after accounting for churn, contraction, and expansion.
Quotable distinction: “Gross retention shows how much existing-customer revenue remains before expansion; net retention shows what remains after both losses and growth within that customer base.” A company can therefore report strong aggregate growth while losing customers if new sales or expansion elsewhere offset those losses. Customer churn tracks lost accounts; revenue churn tracks the recurring revenue those accounts, or reduced contracts, remove. Review both.
Review retention by customer cohort, grouped by start date, and, where data permits, by segment and product. A stable company-wide result may conceal weaker retention among newer customers, within a particular segment, or for a specific product. Cohort trends help distinguish broad-based durability from growth concentrated in selected accounts.
For investors considering technology businesses, these measures can inform a disciplined assessment alongside other evidence. RL Private Holding’s investment activities include venture capital and private equity investment.
CAC, LTV, and SaaS Efficiency: Compare the Economics Behind Growth
Revenue growth shows whether a SaaS business is expanding; acquisition economics help establish what that expansion requires. The key metrics for SaaS companies for investors include customer acquisition cost (CAC), lifetime value (LTV), and CAC payback, but each depends on decisions about which costs, customers, and periods to include. Compare like with like before drawing conclusions.
Customer acquisition cost and payback
CAC is the sales and marketing cost attributed to acquiring customers during a defined period, divided by the number of new customers acquired in that period. The cost base may include advertising, sales compensation, commissions, marketing staff, and allocated tools or overhead. Check which items are counted, how new customers are defined, and whether spending and customer additions are matched to the same period.
CAC payback estimates how long it takes to recover acquisition cost from the gross profit generated by a new customer. A simple calculation divides CAC by monthly gross profit per new customer. Revenue alone is not the recovery measure: hosting, support, implementation, and other costs that affect gross margin may change the result. Check whether sales commissions are included and whether the calculation accounts for sales-team ramp time, since hiring and training can precede the customers those teams eventually acquire.
Lifetime value and growth efficiency
LTV estimates the gross profit a customer may generate over the length of the relationship. It relies on assumptions about churn, gross margin, and customer lifespan; a small change in those assumptions can materially alter the estimate. An LTV-to-CAC ratio is useful only when both figures use consistent customer groups, cost definitions, and time horizons.
Blended averages can hide important differences. Compare CAC and payback by acquisition channel, customer segment, and cohort where data permits. An enterprise segment may have higher acquisition and implementation costs than a self-serve segment, but also a different contract profile. A single company-wide ratio can obscure whether growth is efficient across the business or concentrated in a narrow group.
The table summarises how to use these measures and where interpretation can fail.
| Measure | Key inputs | Investor use | Common caveat |
|---|---|---|---|
| CAC | Defined sales and marketing costs; new customers in the period | Assesses acquisition investment | Cost inclusions and timing may differ |
| CAC payback | CAC; monthly gross profit per new customer | Estimates recovery period | Can omit ramp time or implementation costs |
| LTV | Gross margin; churn; assumed customer lifespan | Frames potential customer value | Depends on assumptions that may be uncertain |
The Rule of 40 adds a broader view by combining annual growth with a profit margin. A result above 40% is often used as a reference point, but it is a heuristic, not a universal investment threshold. The choice of margin measure, company stage, and investment priorities affects its meaning. Assess it alongside unit economics and the quality of reported growth.
How Investors Should Compare SaaS Metrics Across Stages and Business Models
A SaaS benchmark is useful only when the companies being compared share enough operating characteristics for the comparison to mean something. The key metrics for SaaS companies for investors can differ substantially with company maturity, customer type, contract design, and sales approach. Establish the basis for comparison first, then interpret performance against a relevant peer group instead of treating an industry average as a universal standard.
Build a relevant SaaS peer group
Use a consistent sequence to assess comparability:
- 1. Match the business model. Distinguish software subscriptions from businesses with substantial services or other non-recurring revenue.
- 2. Align customer segment and scale. Compare companies serving similar customer types and operating at a reasonably similar level of revenue and maturity.
- 3. Review contracts and revenue profile. Consider contract duration, renewal patterns, billing terms, and the timing of revenue recognition.
- 4. Record material differences. Note geography, product maturity, and go-to-market motion, including whether sales are self-serve, sales-led, or enterprise-focused.
Public-company disclosures can provide useful reference points, but they reflect businesses with different scale, reporting requirements, access to capital, and market conditions than private companies. Use those figures selectively and identify their limitations rather than applying public benchmarks directly to private-company assessments.
Interpret metrics in relation to company maturity
The same result can carry different implications at different stages. For an early-stage company, adoption evidence, emerging retention patterns, and signs that customer acquisition can be repeated may be more informative than established profitability. Growth-stage businesses require closer attention to scaling efficiency, cohort durability, and whether revenue depends heavily on a limited number of customers.
For mature SaaS companies, investors can place greater weight on sustainable profitability, renewal performance, and the conversion of reported earnings into cash. Read these considerations in context, including the company’s investment needs and contract structure.
Business models also shape reported patterns. A usage-based provider may see revenue fluctuate with customer activity, even where accounts remain active. A seat-based provider’s expansion may depend on customers adding users. Enterprise contracts can involve longer sales cycles, larger commitments, and renewal timing that differs from self-serve subscriptions. None is inherently superior. Assess the associated retention, predictability, and acquisition economics against the company’s strategy and customer base.
Peer selection and company maturity also inform venture capital and private equity decisions. Explore venture capital and private equity investment management.
A SaaS Investment Diligence Checklist: Validate Metrics Before Drawing Conclusions
Reported performance becomes useful investment evidence only after the underlying calculations and records have been tested. A consistent diligence sequence helps investors distinguish durable operating results from presentation choices, incomplete data, or assumptions that have not yet been validated.
Validate the definitions and underlying data
Start by requesting a metric dictionary that sets out each formula, reporting period, customer population, and inclusion or exclusion rule. Confirm how the company defines ARR, churn, CAC, and any adjusted financial measures, and identify changes to those definitions over time.
Then trace selected figures to source records. For example, test reported ARR against active customer contracts and billing records, and reconcile recognized revenue with the financial statements. For churn, verify cancellations and reductions in customer spend against account records. For CAC, review the sales and marketing costs included and how new customers are counted. These checks should establish whether management’s figures can be reproduced, not merely whether they appear internally consistent.
Review cohort completeness and exclusions. Ask whether inactive, delinquent, or very small accounts are omitted, whether one-time fees are included in recurring-revenue measures, and whether discounts alter contract value. Reconcile customer cohorts against billing records and examine the accounting policies used to distinguish recurring subscriptions from services or other revenue. Customer concentration, rising churn, heavier discounting, or shifting accounting treatment can all make headline growth less representative of underlying performance.
Synthesize evidence into an investment view
Once the measures are verified, summarise the evidence across four dimensions: growth durability, retention quality, acquisition efficiency, and profitability. State material uncertainties alongside the findings. Separate verified facts, such as reconciled contract and billing data, from management forecasts and investor assumptions, including expectations for renewal, expansion, or future margins.
This discipline supports a clearer assessment of the key metrics for SaaS companies for investors without allowing a strong headline figure to stand in for a full diligence process. It also makes unresolved questions visible, such as incomplete cohorts, customer concentration, or differences between management reporting and financial statements.
RL Private Holding is an investment holding company headquartered in Luxembourg with global operations. Its investment activities include venture capital funding and private equity investment management. These areas provide relevant investment context without implying SaaS-specific portfolio results or performance data: venture capital investment frameworks and private equity investment management.
Make SaaS Metrics Part of a Disciplined Investment View
The key metrics for SaaS companies for investors are most useful when interpreted together. Growth indicates momentum, while recurring revenue and retention help test its durability. CAC, LTV, payback, and profitability add context on the resources required to sustain that growth. Definitions, company stage, and business model also shape what a reported result can reasonably tell you.
A repeatable diligence process strengthens the analysis. Define each measure, trace reported figures to underlying records, and distinguish verified performance from forecasts and assumptions. This helps identify when headline results may be affected by customer concentration, churn, discounting, or reporting choices.
RL Private Holding is a Luxembourg-headquartered investment holding company with a diversified global portfolio spanning technology and other sectors. Its services include venture capital funding and private equity investment management for institutional and private investors. These perspectives support disciplined investment assessment without implying SaaS-specific results.
Explore RL Private Holding’s investment approach to learn more about its investment management services.
Frequently Asked Questions
What are the most important SaaS metrics for investors?
The most important measures assess growth, customer retention, acquisition efficiency, and profitability together. ARR and revenue growth indicate scale and momentum; gross and net revenue retention test customer durability; CAC and payback show the cost and recovery period of acquisition; and gross margin and operating profitability provide context on financial sustainability. The key metrics for SaaS companies for investors are most useful when definitions are consistent and reported figures can be reconciled to underlying records.
How do investors evaluate ARR in a SaaS company?
Investors evaluate ARR by checking how it is calculated and whether it reflects active, recurring customer contracts. They review inclusions such as discounts, usage charges, services, and contracts that have not yet begun, then compare the method across reporting periods. ARR is an operating measure, not cash collected or recognized revenue. Reconciliation with customer contracts, billing records, and financial statements helps establish whether the reported figure is supportable and comparable.
What is the difference between gross revenue retention and net revenue retention?
Gross revenue retention (GRR) measures the recurring revenue retained from existing customers after churn and contraction, before expansion revenue is counted. Net revenue retention (NRR) measures revenue retained from that same customer group after churn, contraction, and expansion are included. GRR therefore isolates revenue losses, while NRR shows the combined effect of losses and increased customer spending. Reviewing both, preferably by cohort and customer segment, helps reveal whether expansion is offsetting underlying attrition.
How do investors calculate CAC payback for a SaaS company?
CAC payback estimates the time needed to recover customer acquisition cost from the gross profit generated by acquired customers. A common calculation divides CAC by monthly gross profit per new customer. The result depends on which sales and marketing costs are included and how customer gross profit is measured. Investors should check for commissions, sales-team ramp time, and implementation costs, and compare payback across acquisition channels or customer segments where the data allows.
Is the Rule of 40 a reliable way to assess SaaS companies?
The Rule of 40 is a useful contextual heuristic, not a standalone test of investment quality. It adds a company’s annual growth rate to a selected profit margin to frame the balance between expansion and profitability. Its result depends on the margin definition, reporting period, and company stage. Investors should interpret it alongside retention, acquisition economics, cash generation, and the quality of reported figures rather than treating a threshold as a universal requirement.
What SaaS metrics matter most for an early-stage company?
For an early-stage company, investors often focus on evidence of customer adoption, early retention patterns, and whether acquisition can be repeated. Revenue growth may be volatile at this stage, and profitability may not yet reflect a mature operating model. Examine customer cohorts, renewal behaviour, the source of new accounts, and the assumptions behind acquisition costs. Treat forecasts as management expectations, then distinguish them clearly from verified operating results.
How can investors compare SaaS companies with different business models?
Investors should first group companies by customer segment, scale, contract structure, revenue profile, and go-to-market approach. Usage-based revenue may move with customer activity, seat-based expansion with user numbers, and enterprise contracts with longer sales and renewal cycles. These patterns affect growth, retention, and acquisition measures, but none is inherently superior. Compare consistent definitions, note material differences, and use public-company benchmarks cautiously when assessing private businesses.