

While US startups raised a record $400 billion in the first half of 2026, much of this capital remains concentrated in AI mega-rounds, creating a significant divergence between reported valuations and actual liquidity. You’re likely aware that high Total Value to Paid-In multiples often obscure the underlying health of a portfolio, especially when distributions to paid-in capital remain stagnant. Mastering the key metrics for evaluating VC fund performance is no longer just about tracking simple multiples. It requires a disciplined analysis of how management fees, which have recently compressed to a median of 1.7 percent for new vintages, impact your net returns over the long term.
This institutional guide provides the sophisticated framework required to distinguish between transitory paper gains and realized cash returns. You’ll gain the technical proficiency to navigate the J-curve during early fund years and learn to accurately compare different fund vintages within a bifurcated market. We’ll also examine the strategic role of Luxembourg institutional structures and their specific impact on achieving superior Net IRR. This overview ensures you have the tools to evaluate GP performance with the precision that the current global financial landscape demands.
Key Takeaways
- Distinguish between unrealized paper valuations and actual liquidity by prioritizing Distributions to Paid-In Capital (DPI) over Total Value to Paid-In (TVPI).
- Navigate the complexities of the J-curve effect to accurately assess fund progress during the initial years of capital deployment.
- Master the key metrics for evaluating VC fund performance through a structured framework that accounts for management fee compression and carried interest impacts.
- Utilize vintage year benchmarking to ensure objective peer-group comparisons across different market cycles and economic environments.
- Understand how Luxembourg-based institutional structures can optimize tax efficiency and enhance net returns for global venture capital allocations.
Foundational Concepts in Venture Capital Performance Evaluation
Effective evaluation of private market investments begins with a precise understanding of capital flows. Unlike public equities where capital is deployed immediately, Venture capital operates on a multi-year commitment cycle. This structural delay necessitates a nuanced approach when identifying the key metrics for evaluating VC fund performance. Accurate assessment requires distinguishing between the total amount promised and the actual capital at work within the portfolio at any given time.
Committed vs. Paid-In Capital Dynamics
Committed capital represents the total legal obligation an investor makes to a fund. Paid-In Capital (PIC) reflects the actual cash transferred to the General Partner (GP) through capital calls. The timing of these calls significantly influences annualized return calculations. If a GP calls capital slowly, the fund’s internal rate of return (IRR) may appear higher due to the shorter duration of capital deployment. Conversely, uncalled capital remains on the institutional investor’s balance sheet, requiring careful liquidity management. A disciplined holding must ensure these commitments are matched with appropriate short-term cash equivalents to fulfill obligations as they arise. This dynamic ensures that capital is available when the GP identifies growth-stage technology opportunities or other strategic assets.
Net Asset Value (NAV) serves as a critical snapshot of the unrealized portion of the portfolio. It represents the GP’s current valuation of all underlying assets minus any liabilities. While NAV provides a benchmark for progress, it remains a paper value until an exit event occurs. Institutional partners use NAV to track the fund’s trajectory, but they remain cautious of its sensitivity to market fluctuations and valuation lag.
Gross vs. Net Performance: The Fee Impact
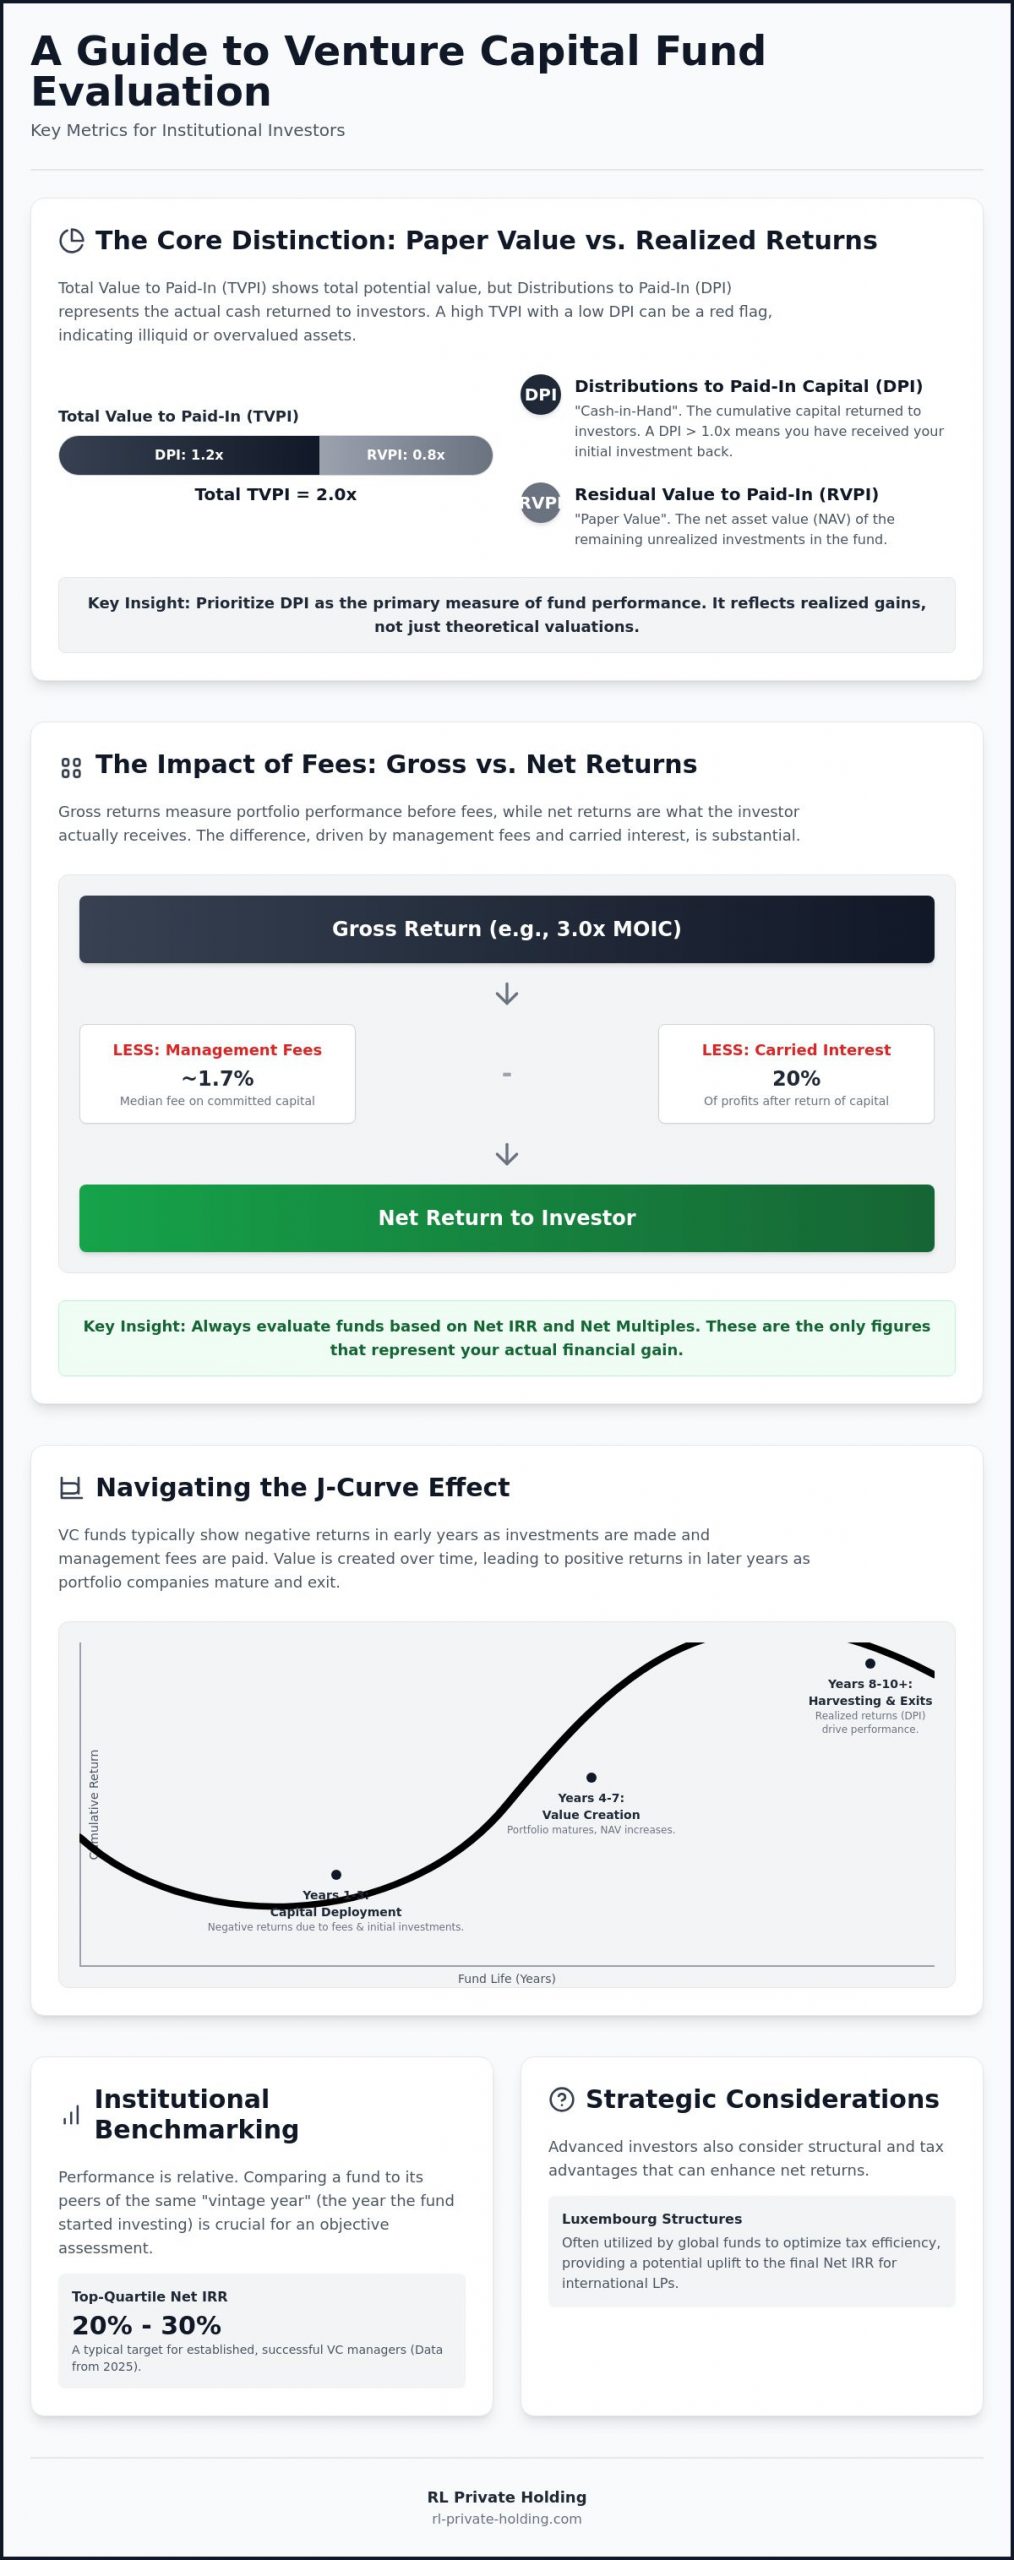
Institutional investors prioritize net performance over gross investment returns because it reflects the actual capital returned to their organization. Gross returns only measure the performance of the underlying companies before the GP’s compensation is deducted. In contrast, net returns account for management fees and organizational expenses. As of 2026, the median management fee for venture funds has decreased to approximately 1.7 percent, yet these costs still create a meaningful drag on performance over a ten-year fund life. Understanding these costs is essential when utilizing key metrics for evaluating VC fund performance to compare different fund managers.
Carried interest also plays a decisive role in the final return profile. The standard rate remains at 20 percent of profits, which is typically distributed only after the Limited Partners have received their initial capital plus a preferred return. For assets held for more than three years, the current tax rate on these gains is 23.8 percent. These structural deductions create a substantial gap between the fund’s gross multiple and the investor’s realized gain. Net IRR serves as the primary metric for assessing the ultimate profitability delivered to the Limited Partner.
Core Multiples for Evaluating VC Fund Returns
Quantitative assessment of venture capital requires a dual focus on absolute wealth creation and the tactical speed of capital appreciation. While the previous section established the importance of net performance, specific key metrics for evaluating VC fund performance allow for a standardized comparison between disparate managers. The primary multiples utilized by institutional allocators include Multiple on Invested Capital (MOIC), Total Value to Paid-In (TVPI), and the Internal Rate of Return (IRR).
Total Value to Paid-In (TVPI) remains a cornerstone for assessing the fund’s total value generation. It combines both realized distributions and the remaining net asset value of the portfolio. Institutional investors rely on these key metrics for evaluating VC fund performance to determine if the risk premium of private markets is being adequately captured. According to 2025 data, top-quartile net IRR for established managers typically ranges between 20 percent and 30 percent, providing a clear benchmark for success.
The Utility and Limits of MOIC
Multiple on Invested Capital (MOIC) measures the total value returned or currently held relative to the capital actually deployed into portfolio companies. It’s a raw cash-on-cash return that strips away the complexity of timing. This metric is indispensable for assessing the fundamental quality of deal-making and the GP’s ability to select winners. However, MOIC does not account for the time value of money. A 3.0x return over four years is significantly more valuable than the same multiple achieved over a decade. Institutional partners typically expect higher MOIC targets from seed-stage funds to compensate for the extended holding periods compared to growth-stage investments.
IRR and the Importance of Timing
IRR provides the annualized growth rate of an investment, making it the standard for time-weighted performance. It’s particularly sensitive to the timing of cash flows. A quick exit at a modest multiple can produce an inflated IRR that doesn’t reflect the fund’s ability to scale capital effectively. Academic research into The Drivers of Venture Capital Performance suggests that consistent, top-quartile performance stems from a GP’s ability to manage both the magnitude and the velocity of returns. IRR is critical for comparing VC to public markets because it accounts for the opportunity cost of capital over specific durations. Institutional investors seeking to optimize these outcomes often benefit from professional asset management that prioritizes Net IRR over gross projections.
The interpretation of these multiples must change as a fund matures. In the early years, high TVPI may be driven by unrealized markups that haven’t faced the scrutiny of an exit. As the fund reaches its eighth or ninth year, the focus shifts toward realized liquidity. A disciplined allocator examines how these multiples evolve over the fund’s lifecycle to ensure that paper gains are transitioning into tangible wealth.
Realized vs. Unrealized Value: DPI and RVPI
The distinction between realized liquidity and paper valuations is the most critical factor for institutional allocators. While Total Value to Paid-In (TVPI) provides a holistic view of performance, the composition of that value determines the actual risk profile of a venture capital commitment. Professional asset management requires a rigorous analysis of how much value is trapped in unrealized holdings versus how much has been returned to the investor as cash. These figures represent the most transparent key metrics for evaluating VC fund performance because they strip away the subjectivity of internal valuation models.
DPI: The Metric of Institutional Truth
Distributions to Paid-In (DPI) represents the ratio of total cash returned to the investor relative to the total capital called by the fund. It is the only metric that provides definitive proof of a General Partner’s ability to navigate the full investment lifecycle, from entry to exit. For any institutional investor, achieving a DPI of 1.0x is a foundational milestone. It signifies that the original principal has been fully recovered. All subsequent distributions represent net profit.
In the 2026 landscape, Limited Partners have placed a heightened emphasis on DPI. This shift follows a period where record-breaking investment totals, such as the $400 billion raised in the first half of 2026, were heavily concentrated in AI mega-rounds that have yet to reach full liquidity. When evaluating the quality of these distributions, RL Private Holding analyzes whether the proceeds were delivered as liquid cash or as stock distributions. Cash remains the preferred medium. Stock distributions often shift the burden of market timing and execution risk back to the Limited Partner, which can complicate the final return profile.
RVPI and Valuation Integrity
Residual Value to Paid-In (RVPI) measures the unrealized value of the remaining portfolio. It is essentially the “paper” gain that has yet to be tested by a terminal exit event. While a high RVPI can indicate a promising trajectory, it also introduces significant valuation risk. This is particularly true in environments where exit markets are stagnant or bifurcated.
Institutional partners must scrutinize the methodology behind these unrealized markups. If a fund’s RVPI is driven by aggressive Net Asset Value (NAV) reporting without recent third-party funding rounds, the likelihood of that value converting to DPI at the stated multiples decreases. In the final years of a fund, typically years 7 through 10, the transition from RVPI to DPI should be methodical and steady. A persistent RVPI late in the fund’s life suggests a portfolio where assets are held past their optimal exit window. Using these key metrics for evaluating VC fund performance allows investors to identify when paper gains are supported by sustainable valuation markups rather than optimistic projections.
Institutional Benchmarking and the J-Curve Effect
Institutional evaluation requires more than just internal multiples. It demands a comparative framework that accounts for the specific market conditions present during a fund’s inception. Without the context of “Vintage Year” benchmarking, even the most robust key metrics for evaluating VC fund performance can lead to erroneous conclusions. A fund launched in a high-valuation environment faces different headwinds than one established during a market correction. Therefore, comparing a 2026 vintage fund to one from 2021 is technically flawed; they must be measured against their direct peers.
The J-Curve and Investor Patience
The J-curve effect is a fundamental characteristic of the venture capital lifecycle where cumulative net returns are typically negative in the early years. This phenomenon is driven by the immediate impact of management fees, which currently hold a median of 1.7 percent for 2026 vintages, and the natural lag between capital deployment and value creation. Early write-offs of underperforming assets often occur before the “winners” in a portfolio have reached a significant markup stage. This creates the characteristic “J” shape on a performance graph as the fund eventually moves toward profitability.
Institutional allocators must distinguish between a standard J-curve and a fund that’s structurally underperforming. A deepening curve that persists beyond year four may indicate poor entry pricing or a lack of operational support for portfolio companies. Maintaining a long-term perspective is essential for achieving superior private equity investment management results. Patience during these formative years allows the portfolio to mature toward the realization phase where distributions begin to outpace capital calls.
Public Market Equivalent (PME) Analysis
To justify the illiquidity premium and high risk associated with venture capital, returns must be compared to public benchmarks. The Kaplan-Schoar PME is the institutional standard for this comparison. It effectively simulates what an investor’s return would’ve been if the same cash flows had been invested in a public index, such as the NASDAQ or S&P 500. This provides a clearer picture of whether the GP is actually adding value beyond what could be achieved in more liquid markets.
A PME score above 1.0 indicates that the venture fund outperformed the public market. This analysis is critical for determining if the complexity of private market allocation is yielding a sufficient alpha. For technology-heavy portfolios, the NASDAQ often serves as a more accurate benchmark than broader indices. Ranking fund managers into quartiles further refines this view. Top-quartile performance, often defined by a net IRR exceeding 20 percent, remains the primary target for sophisticated allocators using these key metrics for evaluating VC fund performance. Integrating these comparative tools ensures that your allocation strategy remains grounded in objective data. For those seeking to refine their institutional approach, wealth management services provided by experienced partners can offer the necessary oversight to navigate these complex cycles.
Strategic Evaluation: The RL Private Holding Approach
Quantitative metrics provide the necessary foundation for any institutional assessment, yet they don’t capture the entirety of a fund’s long-term potential. RL Private Holding employs a framework that integrates these mathematical outputs with rigorous qualitative due diligence. This dual-track approach ensures that the key metrics for evaluating VC fund performance are interpreted within the context of the manager’s operational discipline and the structural efficiency of the investment vehicle. By combining hard data with a deep understanding of fund governance, institutional allocators can better mitigate the inherent risks of growth-stage technology portfolios.
Strategic diversification remains a central pillar of this approach. While sector-specific concentration can lead to outsized returns, it also increases vulnerability to market-specific downturns. A disciplined global partner monitors investments across various technological sectors and geographic regions to balance the portfolio’s risk profile. This methodical oversight allows for steady institutional growth even when certain market segments face temporary volatility or regulatory shifts.
The Luxembourg Advantage for VC Structures
The choice of jurisdiction significantly impacts the net performance of a venture capital allocation. Utilizing the Luxembourg Special Limited Partnership (SCSp) offers a sophisticated environment for managing complex fund structures. This vehicle provides the contractual flexibility required for venture capital while maintaining the high governance and transparency standards expected by global financial centers. The SCSp structure allows for tax-efficient capital calls and distributions, which directly improves the final Net IRR for the investor.
Professional wealth management Luxembourg services further enhance this process by providing the necessary oversight for fund selection and ongoing monitoring. These entities ensure that every investment aligns with the broader institutional strategy and complies with the latest regulatory requirements, such as the SEC’s 2026 AML compliance mandates. This level of structural integrity is essential for maintaining the stability of a diversified asset management portfolio.
Beyond the Math: Qualitative GP Assessment
A comprehensive evaluation must also consider the stability and expertise of the General Partner’s management team. Quantitative data can show past success, but qualitative assessment determines the likelihood of future performance. RL Private Holding evaluates the “Value-Add” capabilities of a firm, looking specifically at how GPs support their portfolio companies through operational expertise and network access. A GP with a history of institutional discipline is more likely to navigate challenging exit environments successfully.
Final considerations for venture capital Luxembourg allocations focus on the alignment of interests between the GP and the Limited Partners. We examine the GP’s personal capital commitment and the logic behind their carried interest structures. When these qualitative factors are aligned with strong key metrics for evaluating VC fund performance, the result is a robust, transparent investment strategy capable of delivering sustained value across multiple fund cycles.
Optimizing Institutional Returns through Disciplined Evaluation
Navigating the complexities of the venture capital landscape requires a commitment to transparency and a focus on realized liquidity. As the market continues to bifurcate, the ability to distinguish between transitory paper valuations and sustainable cash returns remains the hallmark of a sophisticated allocator. Mastering the key metrics for evaluating VC fund performance ensures that your portfolio is measured against objective benchmarks and direct peer vintages rather than optimistic projections. This disciplined approach allows for a clearer understanding of the J-curve and the long-term impact of fee structures on net profitability.
RL Private Holding provides professional asset management from the heart of Luxembourg, offering global expertise in growth-stage technology and private equity. Our firm prioritizes disciplined institutional governance and reporting to provide the clarity required for high-stakes investment decisions. By integrating technical metric analysis with a global operational scale, we assist partners in achieving superior long-term results within a stable structural framework. Explore strategic venture capital allocation with RL Private Holding to refine your approach to private market investments. Building a resilient portfolio starts with a steady hand and a clear plan for future growth.
Frequently Asked Questions
What is the most important metric for evaluating a VC fund?
Distributions to Paid-In Capital (DPI) is widely considered the most critical metric for institutional investors because it measures actual cash returned. While other key metrics for evaluating VC fund performance like TVPI provide a snapshot of total value, they include unrealized “paper” gains. DPI is the ultimate measure of a General Partner’s ability to navigate the full investment lifecycle and deliver tangible liquidity to their partners.
How does the J-curve affect VC fund performance in the first three years?
The J-curve typically causes a fund’s net returns to appear negative during its first three years of operation. This phenomenon occurs because the fund is drawing management fees and incurring organizational expenses before its portfolio companies have reached significant valuation milestones. Initial write-offs of underperforming assets often precede the growth of eventual winners, creating the characteristic “J” shape on a performance graph as the fund matures.
What is a good TVPI multiple for a mature venture capital fund?
A TVPI multiple of 3.0x or higher is generally indicative of top-quartile performance for a mature venture capital fund. However, this benchmark must be interpreted in the context of the fund’s specific vintage year and investment strategy. In the current 2026 market, sophisticated allocators also examine the ratio of realized to unrealized value within that multiple to ensure the gains are supported by actual exit activity.
How do management fees impact the Net IRR of a VC investment?
Management fees create a direct drag on the Net IRR by reducing the total capital available for deployment and eventual distribution. In 2026, the median management fee for new vintages has compressed to approximately 1.7 percent. Despite this compression, these costs still require the fund to generate higher gross returns to meet target net performance levels. Investors must carefully account for these fees when utilizing key metrics for evaluating VC fund performance.
What is the difference between MOIC and TVPI?
MOIC measures the raw cash-on-cash return at the individual deal level, whereas TVPI is a comprehensive fund-level metric. TVPI is more relevant for Limited Partners because it reflects the total value generated relative to all capital called, including the impact of management fees and fund expenses. While MOIC demonstrates a manager’s ability to select successful companies, TVPI provides a more accurate representation of the investor’s actual net position.
How often should an institutional investor review VC fund metrics?
Institutional investors should perform a formal review of fund metrics on a quarterly basis to align with the General Partner’s reporting cycle. This frequency allows for the consistent tracking of capital call patterns and valuation adjustments. A more rigorous strategic assessment is typically conducted annually. This deep dive evaluates the fund’s progress along the J-curve and its performance relative to specific vintage year benchmarks and public market equivalents.
Why is DPI more reliable than TVPI for late-stage funds?
DPI is more reliable for late-stage funds because it represents realized liquidity that’s no longer subject to market volatility or valuation subjectivity. As a fund reaches its final years, a high TVPI may be driven by Residual Value to Paid-In (RVPI), which consists of unrealized paper gains. Since these assets still face execution risk during the exit process, DPI serves as the only definitive proof of a manager’s success.